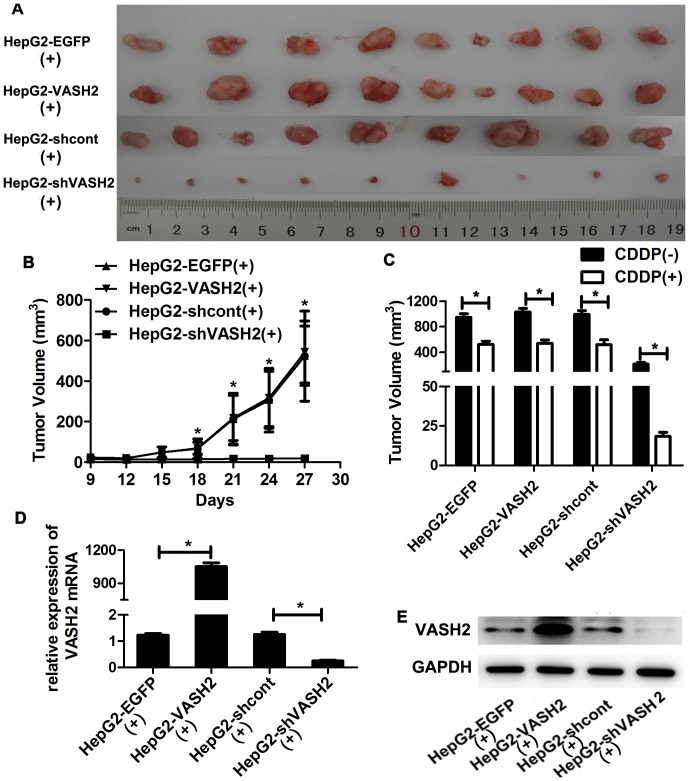
Figure 5. VASH2 influenced the sensitivity of tumor cells to CDDP in vivo.
HepG2-VASH2, HepG2-EGFP, HepG2-shVASH2, or HepG2-shcont cells were suspended at a density of 107 cells/ml, and 100 µl was injected into the flank of nude mice (n = 9). On day 9, mice in CDDP(+) group were given CDDP (10 mg/kg) intraperitoneally every 3 days. After six 3-day cycles of treatment, all nude mice were sacrificed, and tumors were excised from nude mice. (A) The HepG2-shVASH2 tumors were smaller than those of the HepG2-shcont groups, whereas the size of the HepG2-VASH2 tumors did not significantly differ from that of HepG2-EGFP tumors. (B) Tumor growth curves. Tumor volume was calculated 3 days after the first treatment with CDDP using the formula (W 2×L)/2 every 3 days. The data are presented as the mean ± SD of nine tumors per group. *A significant difference was found between the HepG2-shVASH2 and HepG2-shcont groups (P<0.05). (C) The comparison of tumor volume between CDDP(+) group and CDDP(−) group(*P<0.05). (D and E) Total RNA and protein were extracted from CDDP(+) group randomly, and VASH2 expression was measured by qRT-PCR and Western blot analyses.

