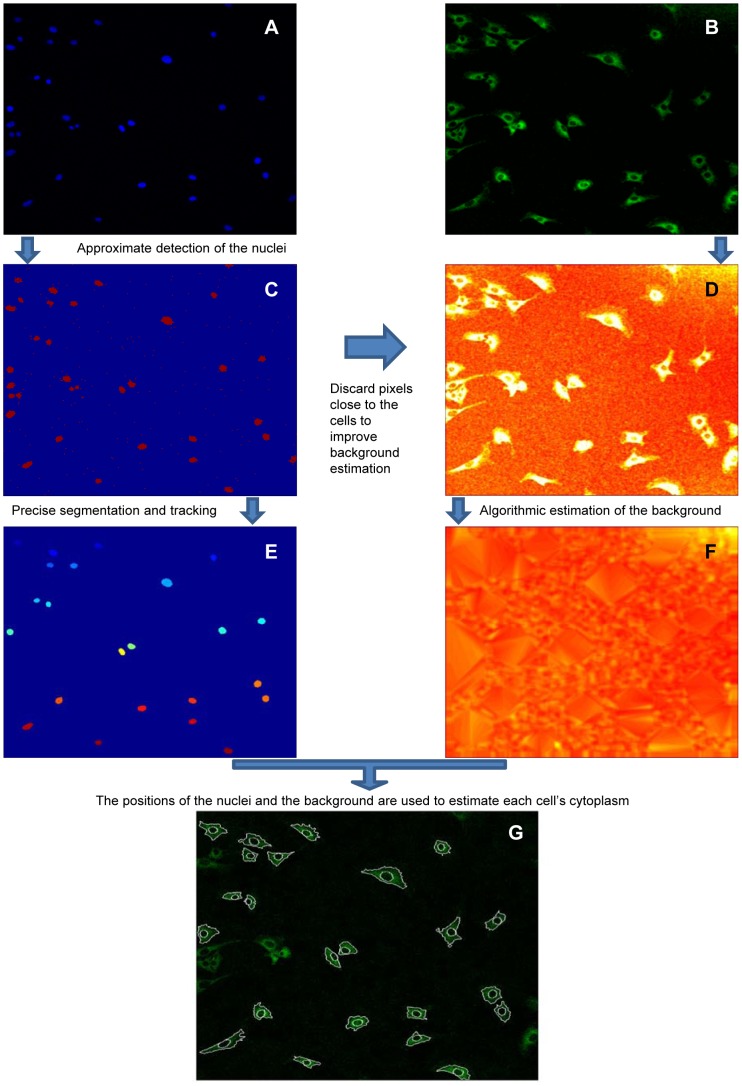
Figure 2. Workflow of the automated method for the quantification of nuclear-to-cytoplasmic dynamics of GFP-p65.
For each frame we generate two images, a HOE image of the stained nuclei (A) and a GFP image of GFP-p65 (B). (C) The HOE image shown in A (pseudocolors) is divided in tiles and by a K-means algorithm we determine a threshold used for an approximate detection of the nuclei. (D) The approximate position of the cells – derived from the approximate nuclei position – is taken into account for the estimation of the background of the images, which is spatially inhomogeneous. (E) The segmentation of the nuclei is refined by computing the average brightness of each nucleus that is used to determine a nucleus-specific threshold (the colorcode is based on the incremental identification of nuclei). (F) An algorithm is used to reconstruct the background for the full image. Of note, the background clearly varies in space. (G) Using the local background estimation we identify the boundaries of each cell. The nuclear to total ratio (NT) of the GFP-p65 protein is then calculated using the segmentation of nucleus and cytoplasm of each cell as described in the Results.

