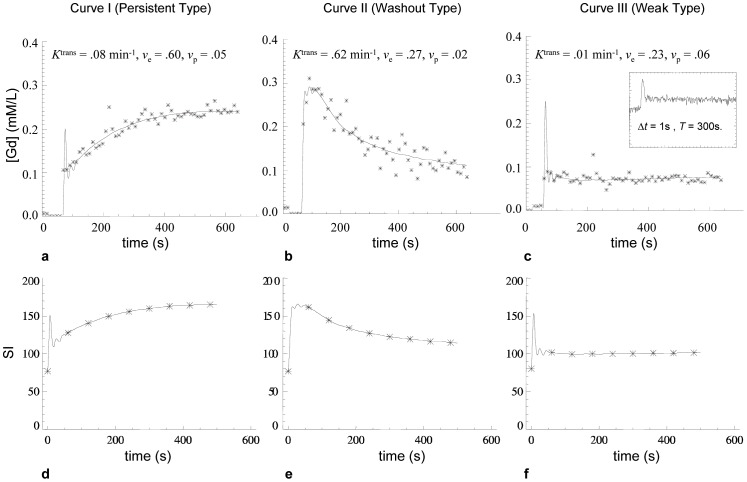
Figure 1. Shows examples of the three typical kinetic enhancement curves used for modelling.
curve I (persistent type), curve II (washout type), and curve III (weak enhancement). (a–c) demonstrate the [Gd] curves fitted with the modified Tofts model using the ICR-DICE method. The fitted kinetic parameter values are given above each curve. The small panel at the up-right corner of (c) shows the SI curves from the corresponding region in the high-temporal resolution (Δt = 1 s) pre-bolus data set of the ICR-DICE acquisition. (d–f) demonstrate the SI curves converted from the fitted [Gd] curves. A 1-minute temporal resolution was used to extract data from the theoretical SI curves (showed as asterisk points), which are used as the ‘true’ SI enhancing curves in the following Monte Carlo simulations.

