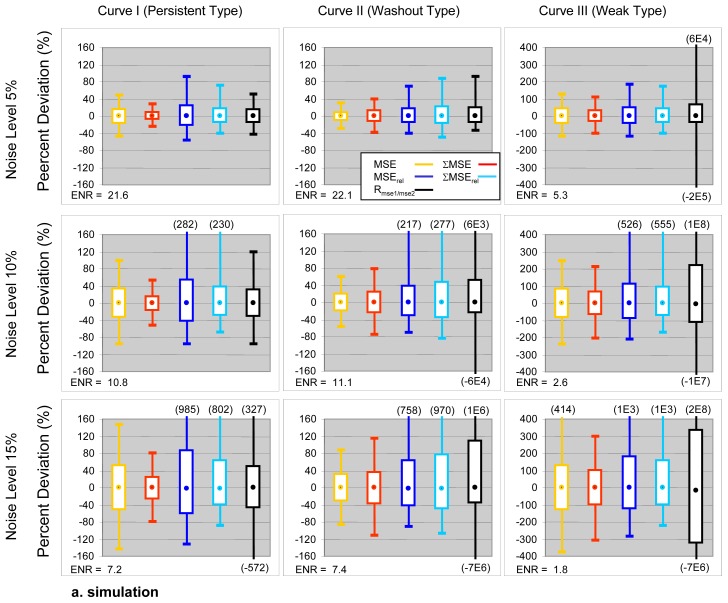
Figure 3. Box-and-whisker plots showing the PD distributions of the five empirical parameters.
The range between 5th–95th percentiles is shown by the box. Extreme values are shown by whiskers. Median is shown by a dot within the box. The PD distributions calculated from 1000000 Monte Carlo repetitions. ENR for each simulated condition are annotated. Formula for calculation of ENR can be found in Table 1.

