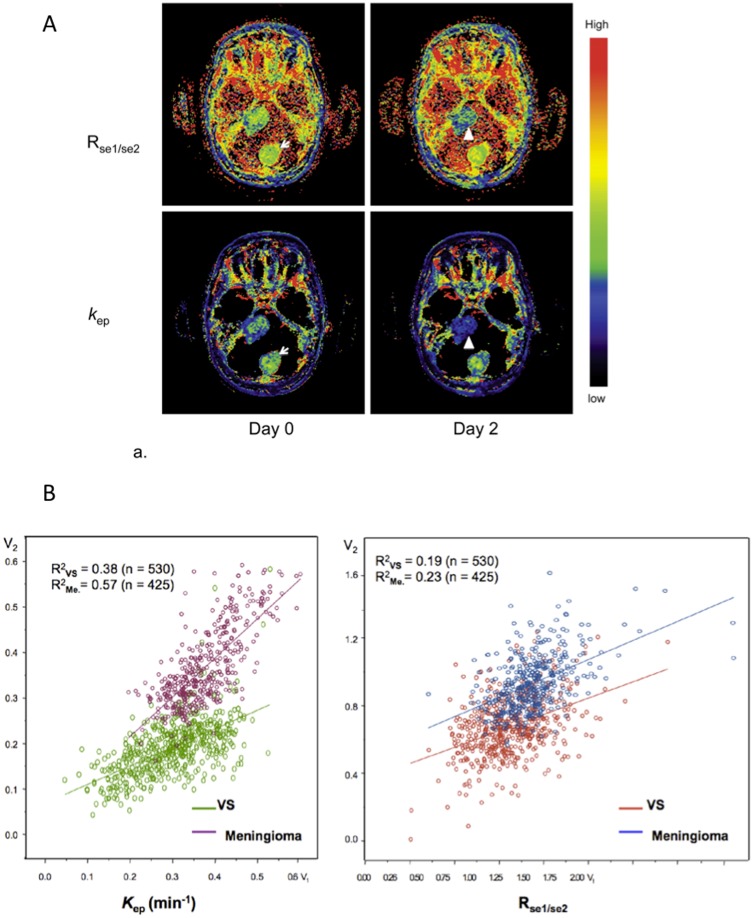
Figure 4. Demonstrating direct comparisons between Rmse1/mse2 and k ep in response to treatment in a single patient.
(a) Longitudinal spatially co-registered maps of Rmse1/mse2 (top) and k ep (bottom) before (left) and 3 days after bevacizumab treatment (right) from a central slice of the tumors. (b) Pixel-by-pixel scatter plots of the parametric values (3 days post-treatment against the pre-treatment) produced from the right vestibular schwannoma and the meningioma on the same slice as in (a). The values of Rmse1/mse2 were calculated with an average of the five pre-contrast baseline measurements as SIpre, MSE1 = MSE1min and MSE2 = MSE5min. Mean k ep of VS was 0.30±0.10 on day 0 and 0.19±0.08 on day 3. Mean k ep of meningioma was 0.38±0.09 on day 0 and 0.36±0.09 on day 3. Mean Rmse1/mse2 of VS was 0.82±0.22 on day 0 and 0.68±0.19 on day 3. Mean Rmse1/mse2 of meningioma was 0.94±.27 on day 0 and 0.94±0.18 on day 3.

