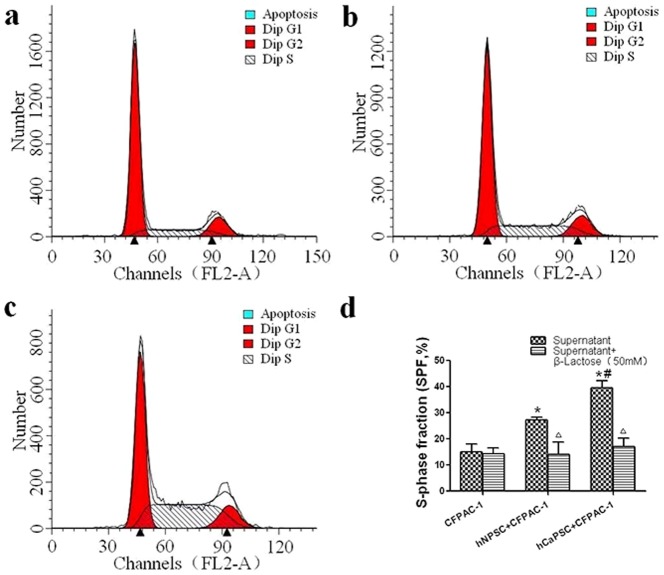
Figure 4. PSCs derived Galectin-1 promotes the proliferative activity (S-phase fraction) of CFPAC-1 cells.
(a–c) Quantitative graphical representation of Apoptosis, G1, G2 and S cell population. Points, average of three independent experiments. a, CFPAC-1; b, CFPAC-1 + hNPSC; c, CFPAC-1 + hCaPSC. (d) A bar-graphical representation S-Phase Fraction cells in each group. *p<0.01 vs. CFPAC-1, #p<0.05 vs. hNPSC+CFPAC-1, △ p>0.05 vs. hNPSC +β-Lactose.

