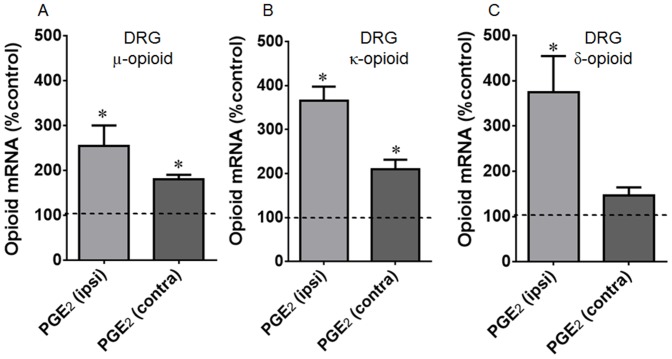
Figure 2. Intraplantar injection effect of prostaglandin E2 (PGE2) on gene (A, C, E) expression of μ (A), κ (B) and δ (C) opioid receptors.
The changes in mRNA levels of opioid receptors were determined by real time PCR, in dorsal root ganglia (DRG) obtained 3 h after PGE2 injection (100 ng/paw). Dotted line represents the values obtained in naïve animals. Data are presented as mean of 7 animals ± SEM and expressed as % of control (naïve) animals. * Significantly different from mean values of naïve animals (p<0.05). Data were analyzed by one-way analysis of variance (ANOVA) with post-hoc testing by Tukey.

