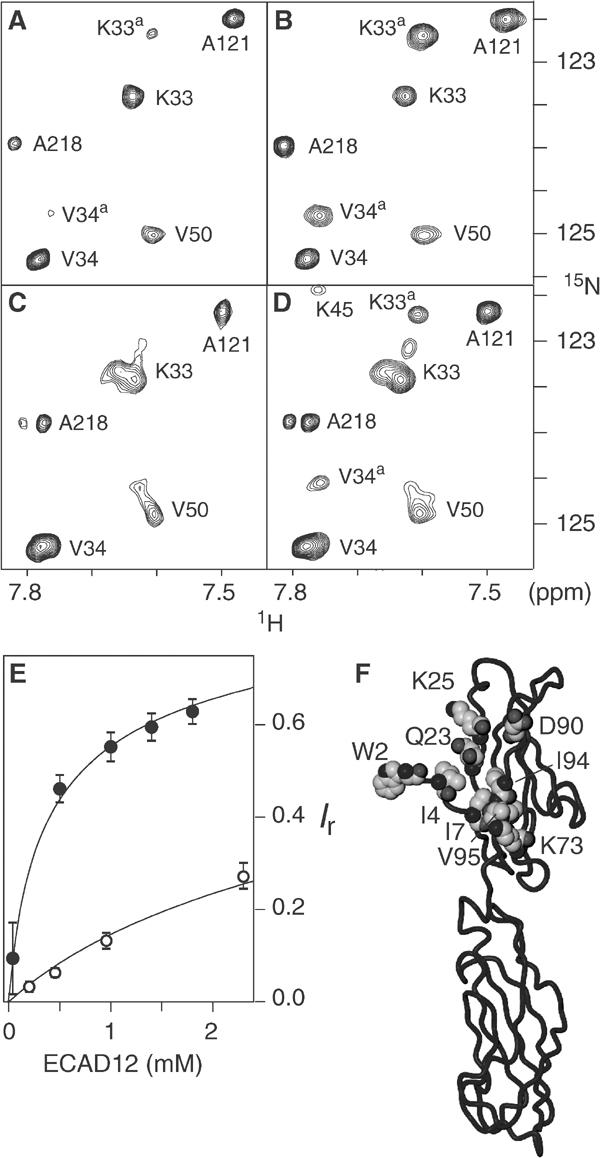
Figure 6.

NMR spectroscopic evidence of ECAD12 homoassociation in the presence and absence of calcium. Small regions of 1H-15N TROSY spectra are shown for total ECAD12 concentrations of 40 μM (A) and 0.5 mM (B) in the presence of calcium, and for 60 μM (C) and 1.1 mM (D) in the absence of calcium. Resonances are labelled with assignment information. The associated species is indicated by a superscript ‘a'. (E) Relative intensity Ir=Ia/(Im+Ia) of the associated species as a function of total ECAD12 concentration. Intensities of the monomeric (Im) and associated (Ia) species were obtained as an average of peak volumes for residues, which showed well-separated resonances. Filled and open circles correspond to calcium-bound and calcium-free conditions, respectively. The solid lines present fits to the data assuming a bimolecular reaction with a KD of 0.72 mM for the calcium-bound and of 10 mM for the calcium-free protein, respectively. (F) Residues that show the strongest observable 1H-15N chemical shift differences between the monomer and associated species in the calcium-bound form are shown in space-fill representation in the crystal structure of ECAD12.
