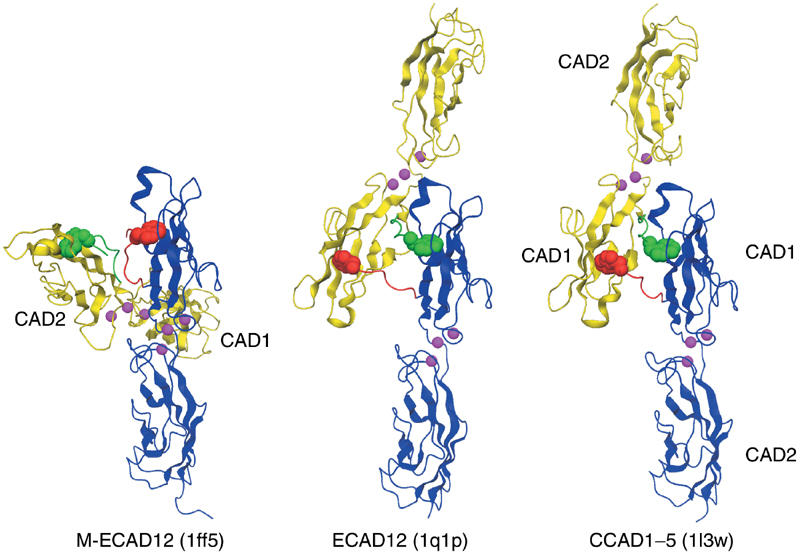
Figure 7.

Comparison of the ECAD12, M-ECAD12, and CCAD1–5 crystal structures. The interacting monomers are shown in blue and yellow with their respective N-termini in red and green. The W2 residue is shown as space-fill. For better comparison, the blue CAD12 domains are shown in the same orientation for all three structures. Calcium atoms are indicated in magenta.
