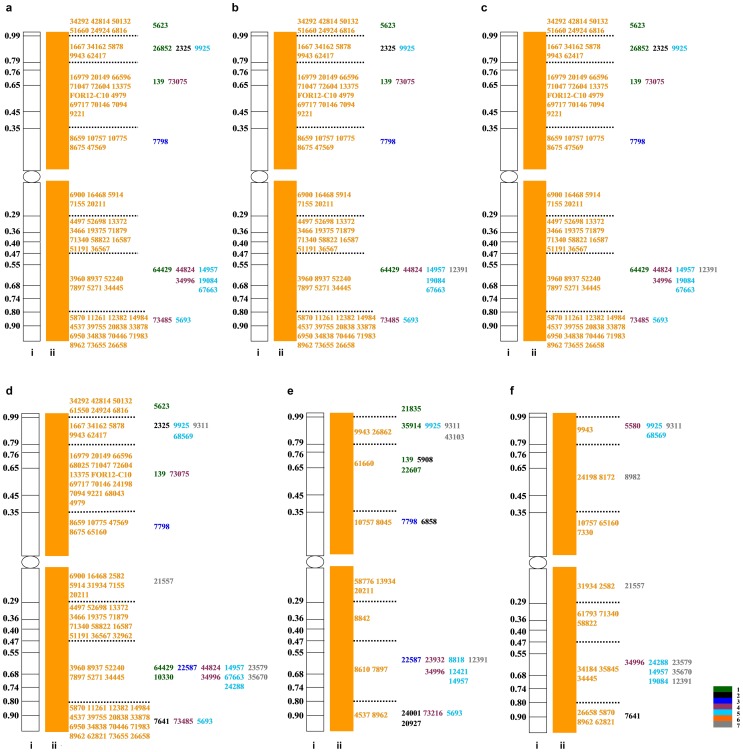
Figure 6. Comparative maps of A. cristatum chromosome 6P in the six addition lines.
a, b, c, d, e, and f represent the A. cristatum chromosomes in the disomic addition lines 4844-12, 5113, 5114, 5106, II-29-2i, and II-26, respectively. i: Consensus bin map of wheat group 6; ii: The specific markers distributed in different bins along the chromosome 6P. The colored strips and the numbers 1, 2, 3, 4, 5, 6, and 7 represent the homoeologous groups 1 to 7. The colored markers which belonged to different homoeologous groups were consistent with the colored strips. The ‘Agc’ of the marker names were ellipsis in the maps.

