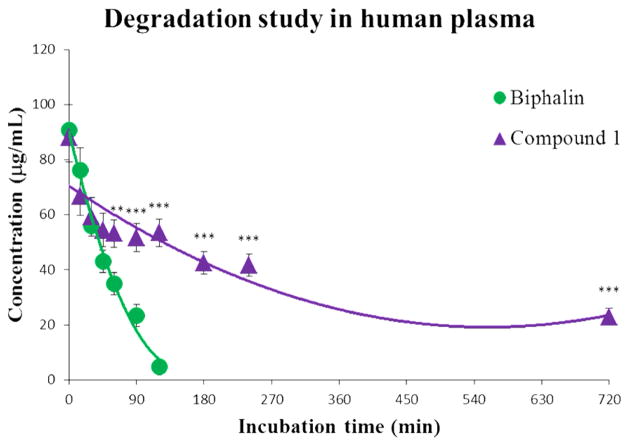
Figure 3.
Stability curves for Biphalin (green line) and the Biphalin derivative 1 (purple line). The samples were tested in three independent experiments (n = 3) and represent the mean ± SEM. The significance among groups was evaluated with the analysis of variance (two-way ANOVA test) followed by Bonferroni’s posthoc comparisons between compound 1 and Biphalin using the statistical software GraphPad Prism v.4. Statistical significance was P < 0.05 (**P < 0.01; ***P < 0.001); times from t0 to t45 present no statistical significance (P > 0.05).

