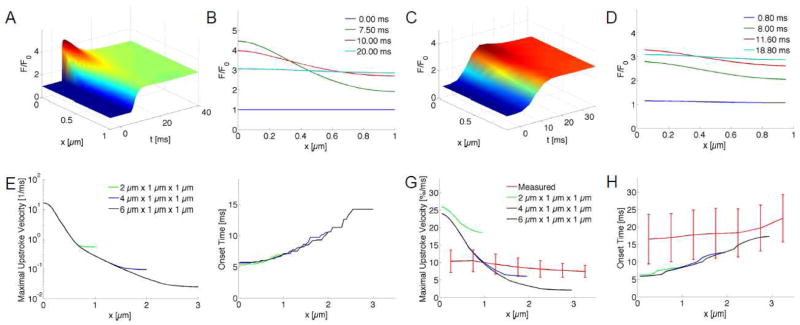
Fig. 5.

Modeling and analysis of Ca2+ signals. (A) [FLUO-Ca] was calculated in a three-dimensional domain with a size of 2 μm x 1 μm x 1 μm with a single central release site. Release at the site (x=0 μm) occurred at t=5 ms. The self-ratioed signal [FLUO-Ca]/ [FLUO-Ca]0 (F/F0) was plotted along the along the x-semiaxis. (B) The signal along the x-axis is shown at 0, 7.5, 10 and 20 ms. (C,D) The signal was sampled at 277 Hz, convolved with a PSF and filtered as for processing of measured fluo-4 images. The signal exhibits blurring and attenuated peak values versus (A). (E) The maximal upstroke velocities were calculated from simulations with different domain sizes. All models had a single central release site. Upstroke velocities were maximal at the release site and exhibit an approximately exponential attenuation with distance to the release site. (F) Activation times were minimal at the release site and delayed of up to 14.2 ms at distal sites (x=3 μm). (G) Maximal upstroke velocity of self-ratioed modeled transient from (C) overlaid with measured data (red). (H) Modeled activation times overlaid with measured data (red).
