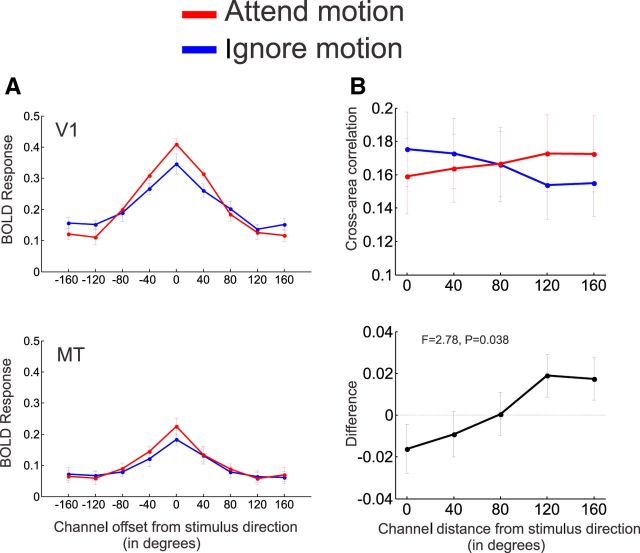
Figure 4.
A, Mean channel response profiles, similar to Figure 3 but with Kronecker δ basis functions used in the forward model computation. B, Top, Cross-area correlations between similarly tuned channels in V1 and MT (with channel responses computed using δ basis functions, as in A). Bottom, Change in cross-area correlations with attention. The error bars are quite large in the top because of large differences across subjects. However, the SEM of the difference between the blue and red curves is much smaller, reflecting a consistent effect of attention across subjects (B, bottom). The x-axis indexes the distance of a channel from the stimulus direction; channels with the same negative and positive offset were averaged to increase statistical power. Error bars indicate between-subject ±1 SEM (N = 12).

