Figure 3.
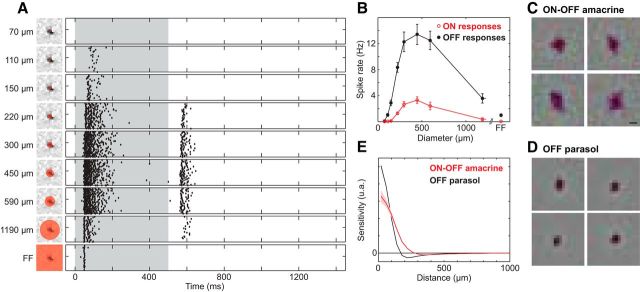
ON-OFF light responses and receptive field surrounds in PACs. A, Decrements of light (0.0–0.5 s, 48% contrast) were delivered 35 times to the receptive field center (left panels) and responses recorded for 1.5 s. Steps were delivered to regions of increasing size relative to the receptive field (red circles). Each panel on the right shows a raster of responses to repeated stimulation: each tick indicates the time of a spike, and data from repeated presentations are shown in separate rows. Strong responses following light decrement (time 0) were accompanied by variable-strength responses at light increment (time 0.5 s). Size of a spot is given as the diameter. FF, Full-field stimulation. B, Area–response function for four ON-OFF PACs in one recording, showing the mean spike count (±1 SEM) for dark spots of increasing diameter, as in A. OFF response (closed dots, 0–0.5 s) and ON response (open circles, 0.5–1 s) are shown separately. C, Receptive fields of four ON-OFF amacrine cells, obtained by reverse correlation with white noise (see Materials and Methods) are shown, with each image centered on the receptive field of the cell. The strong dark region, indicating a dominant OFF response, was surrounded by weaker light regions, indicating an antagonistic receptive field surround. Scale bar, 200 μm. D, Same as C, for four OFF parasol cells. The surround is similar but more easily discerned. E, Cross-sectional profile of receptive fields in data from C and D for 29 ON-OFF PACs and 249 OFF parasol cells in one recording. Shaded area represents ±1 SEM.

