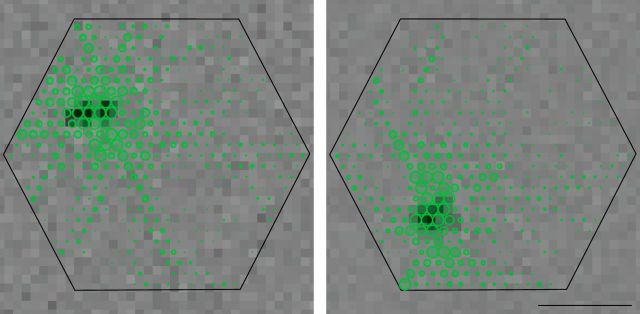
Figure 4.
Relationship of receptive fields to dendritic and axonal fields of PACs. Electrical images (green) are shown for two cells, superimposed on the hexagonal outline of the electrode array (Fig. 1). In the electrical image of each cell, long radiating processes are evident and distinct from the dense central region of somatic and dendritic spikes. Receptive fields obtained by reverse correlation with white noise are shown as grayscale images in the background, with the dark central region coinciding with the region of recorded somatic and dendritic spikes in the electrical image. Scale bar, 1 mm.

