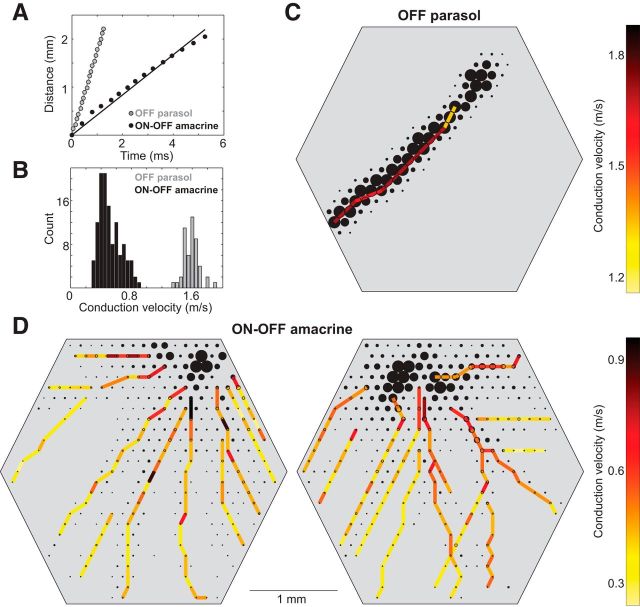
Figure 6.
Propagation speed of axonal spikes. A, Times of axonal spikes obtained from specific electrodes (Fig. 1A,D) are shown along with the distance the spike traveled along the axon. Monotonic increase in spike time with distance is consistent with propagation of the spike along the axon. For an OFF parasol cell (gray), the data were well described by a line, consistent with constant propagation speed. For one axon of a simultaneously recorded PAC (black), the data were curved slightly downward, consistent with gradually decreasing propagation speed. B, Distributions of average propagation speeds for all 61 OFF parasol and 15 PACs recorded in one preparation. Speeds for each axon were obtained by fitting lines to data such as those in A. Systematically higher conduction speeds were observed in parasol cells. C, Spatial arrangement of propagation speeds, measured locally, are shown for an OFF parasol cell. Local propagation speeds were given by the ratio of distance to time of the spike, recorded on pairs of nearby electrodes, sampled at many points along the axon. D, Same as C. for two simultaneously recorded PACs. Gradual decrease in propagation speed is indicated by the change in color as a function of distance from the soma.

