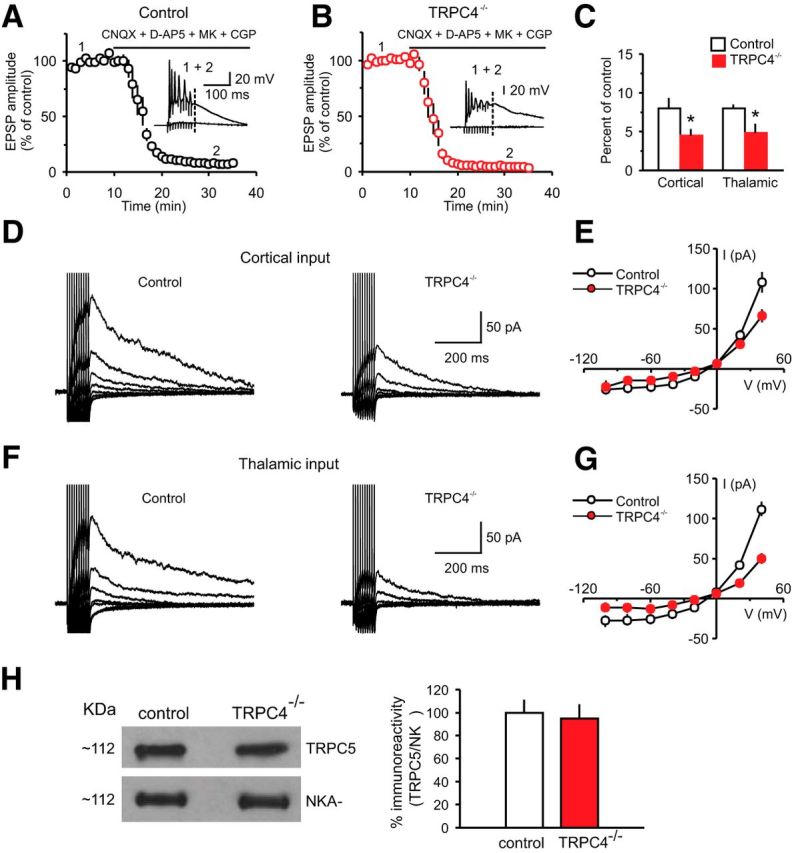
Figure 9.

mGluR-EPSCs in LA neurons are suppressed in TRPC4−/− mice. A, Synaptic responses in cortical input to the LA neuron in a slice from a control mouse evoked by trains of high-frequency stimulation before and during addition of CNQX (AMPA receptor antagonist; 20 μm), NMDA receptor antagonists, d-APV (50 μm), and MK-801 (10 μm) and GABABR antagonist CGP 35348 (300 μm) recorded as described previously (Riccio et al., 2009). Stimulation trains consisted of 10 pulses at 100 Hz which were delivered once every 30 s. Inset shows synaptic responses recorded in current-clamp mode before (1) and after (2) the addition of antagonists to the external medium. The dashed line indicates the time point where the EPSP amplitude was measured. B, The experiment was identical to A, but the recording was obtained from a TRPC4−/− mouse. C, Summary data for the experiments as in A and B, performed in both cortical and thalamic inputs to the LA. The amplitude of the residual component of the EPSP in the presence of antagonists was smaller in both pathways in slices from TRPC4−/− mice compared with control littermates. D, EPSCs in cortical input recorded in voltage-clamp mode at holding potentials ranging from –100 mV to +40 mV in slices from control (left) and TRPC4−/− (right) mice in the presence of the antagonists (as in A). E, Current–voltage (I–V) plots of the peak current in cortical input (as in D) in slices from control and TRPC4−/− mice. F, EPSCs in thalamic input recorded in voltage-clamp mode at holding potentials ranging from –100 mV to +40 mV in slices from control (left) and TRPC4−/− (right) mice in the presence of the antagonists (as in A). G, Current–voltage (I–V) plots of the peak current in thalamic input (as in F) in slices from control and TRPC4−/− mice. H, Left, Representative immunoblot shows similar amounts of TRPC5 protein in brain microsomes extracted from control or TRPC4−/− littermates. Western blotting of Na+-K+-ATPase indicates equal protein loading (bottom). Right, Quantification of three different blots. Results are shown as mean ± SEM.
