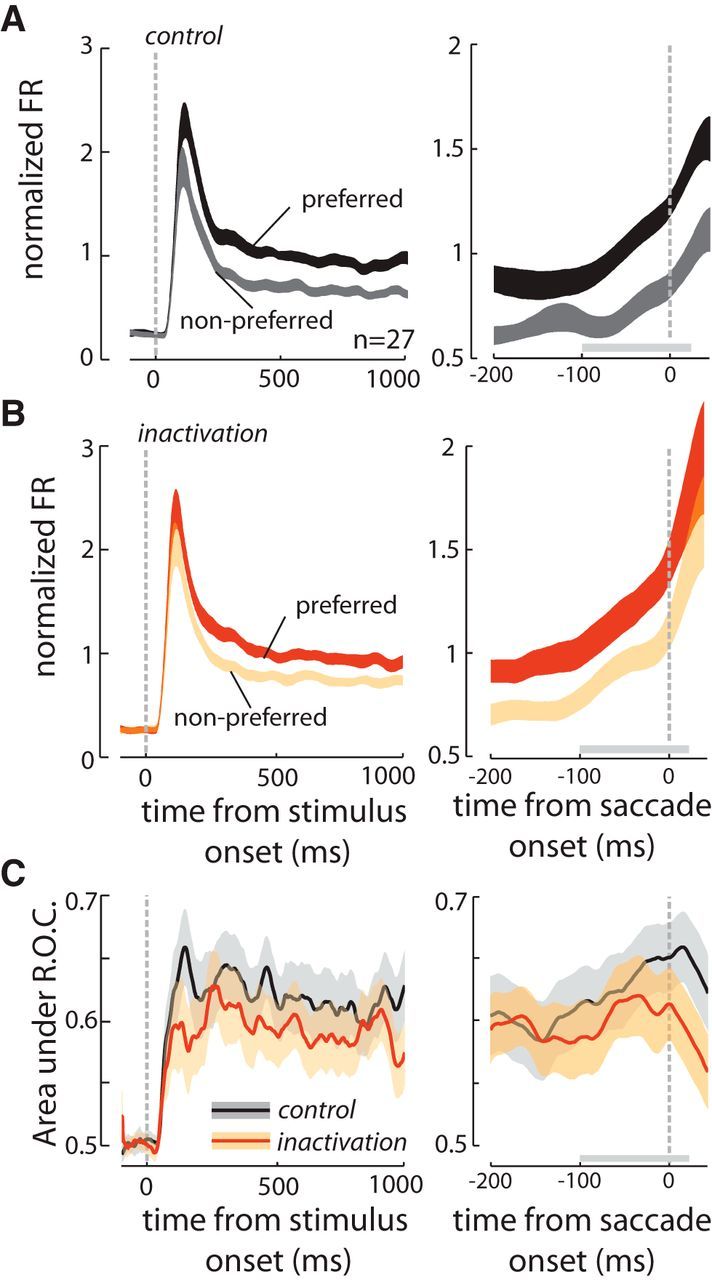
Figure 7.

Effects of FEF inactivation on V4 responses to preferred and nonpreferred stimuli. A, Visual responses of 27 stimulus-selective V4 neurons to preferred (black) and nonpreferred bar orientations (gray) before FEF inactivation. Responses are shown aligned to the onset of the visual stimulus (left axis), and to the onset of the saccade (right axis), for saccades toward the V4 RF only. B, Responses of the same 27 V4 neurons after FEF inactivation, for preferred (orange) and nonpreferred stimuli (peach). C, Selectivity of V4 visual responses, measured as the area under an ROC curve, before FEF inactivation (black) and after FEF inactivation (orange); responses are shown aligned to stimulus onset (left axis) and saccade initiation (right axis). ROC area calculated in a sliding 50 ms window.
