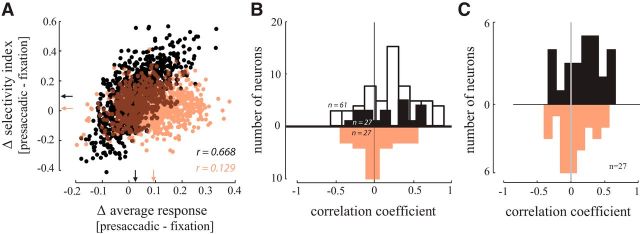
Figure 9.
The relationship between presaccadic enhancement and the stimulus selectivity index of V4 neurons. A, Correlation between presaccadic changes in average response and stimulus selectivity for an example V4 neuron before (black) and after (salmon) inactivation. Each point represents changes in average response (preferred and nonpreferred) and stimulus selectivity index (preferred vs nonpreferred) computed for a randomly selected subset of trials. Arrows indicate the marginal means. Pearson correlation coefficients (r) computed for data before and after inactivation are shown. B, Distributions of correlation coefficients for all 27 V4 neurons recorded before (black) and after FEF inactivation (salmon), calculated using the subsampling method illustrated in A. The distribution of correlation coefficients for a population of 61 V4 neurons from a previous study (Moore and Chang, 2009; white) is also shown. C, Distributions of correlation coefficients for the same 27 V4 neurons recorded before (black) and after FEF inactivation (salmon), calculated using the trial-pairing method.

