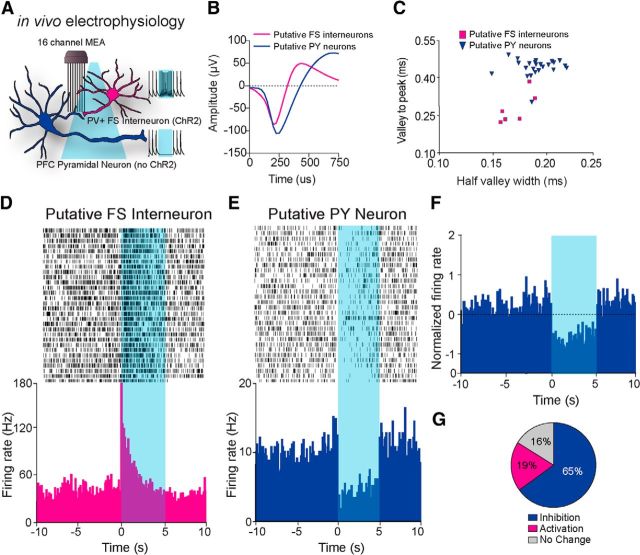
Figure 2.
In vivo electrophysiological analysis of mPFC neurons. A, Schematic diagram depicting combined in vivo electrophysiological and optogenetic manipulations in the mPFC, with typical change of firing rate in putative pyramidal neurons and putative PV+ FSIs in response to blue light stimulation. B, Example isolated waveform from an optically identified putative mPFC pyramidal PV+ FS interneuron and pyramidal neuron. C, Classification of putative PY and FS interneurons based on the correlation of the electrophysiological parameters, valley to peak duration (ms) and half-valley width (ms). D, E, Representative perievent histograms and raster plot of a single unit putative PV+ FSI (D) and pyramidal neuron (PY; E) time locked to 5 ms light stimulation. F, Normalized change in firing of all recorded putative mPFC PY neurons (n = 24 units) in response to optical activation of PV+ FS interneurons. G, Pie chart of three characteristic neural firing responses to optical stimulation and the proportion of all recorded neurons that displayed increased firing (activation), decreased firing (inhibition), or no change (n = 37 units).

