Figure 5.
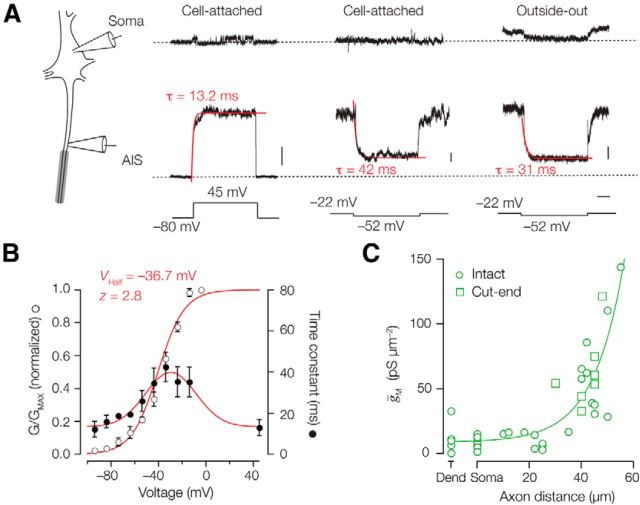
Voltage dependence, kinetics, and current density of IM in the AIS. A, Left, Schematic drawing indicating the different recording positions at the L5 soma and AIS. Right, Putative M-currents obtained in cell-attached and outside-out recordings from the soma (top) and axon initial segment (middle). Voltage-clamp step protocols are indicated at the bottom. Traces represent the average of >5 trials for each single patch. Currents obtained at the AIS were fit with single exponential functions (red). Calibrations: 5, 1, and 5 pA, respectively; 100 ms. B, For three outside-out patch recordings, voltage steps were obtained for a large voltage range between −92 and −2 mV. The 45 mV data were obtained from the cell-attached recordings. Time constants (closed circles) fitted to a Gaussian function (y = 13.4 + 26.3 e [−((x − 29.7)/30.3)2]). Steady-state voltage dependence of activation (open circles) fit with a single-power Boltzmann function with the indicated parameters. Symbols represent the mean ± SEM. C, Subcellular conductance density distribution along the AIS and somatodendritic membrane. Recordings from intact AIS (open circles) and cut-end AIS (open squares) were combined and fit with an exponential function, y = 8.7 + 1.1 e−0.086 x. Dend, Dendrite.

