
Figure 7.
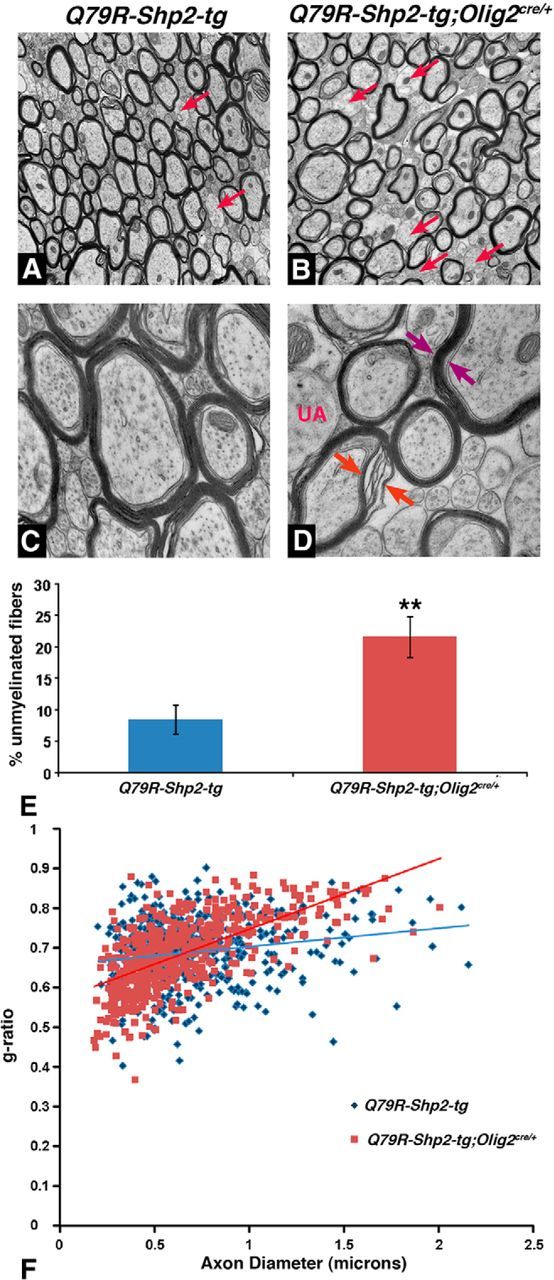
Abnormal myelination in postnatal forebrain after expression of Q79R-Shp2 GOF mutation in Olig2 lineage. Electron micrographs at P60 show fewer myelinated axons (B, red arrows) in Q79R-Shp2-tg;Olig2cre/+ animals compared with Q79R-Shp2-tg controls (A). Q79R-Shp2-tg;Olig2cre/+ animals displayed abnormal myelination (D, red arrows) and in rare cases what appeared to be a thicker myelin sheath (D, purple arrows) compared to controls (C). E, Graphical representation of unmeylinated axons shows that Q79R-Shp2;Olig2cre/+ mice exhibited increased unmyelinated fibers in the CC (N = 3) compared with controls. Significance was determined using a Student's t test. **p < 0.005. F, Graphical representation of g-ratio, which is the ratio of the diameter of the axon to the diameter of the axon and myelin, shows Q79R-Shp2;Olig2cre/+ with a g-ratio of 0.693 (N = 3) compared with controls, which show a g-ratio of 0.698 (N = 3 for each genotype).