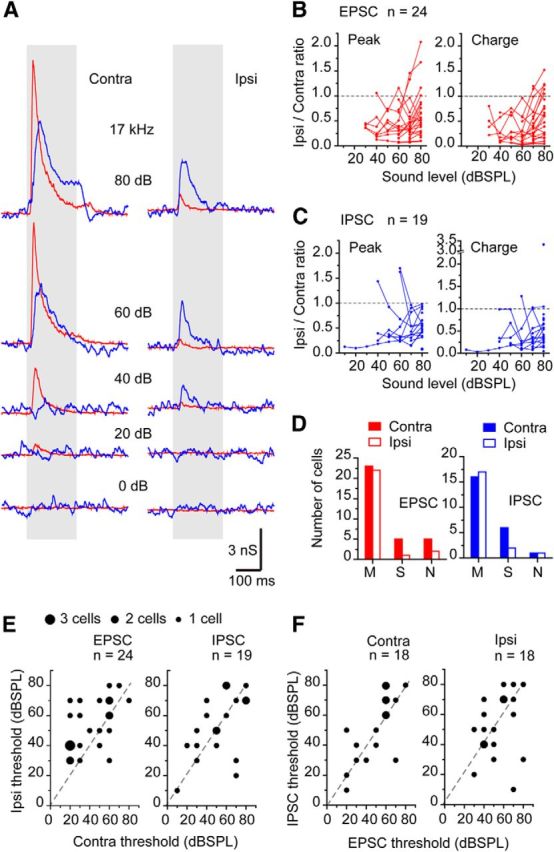
Figure 2.

The most IC neurons had excitatory and inhibitory inputs to monaural contralateral and ipsilateral sound stimuli. A, The representative synaptic responses of IC neurons to monaural contralateral and ipsilateral BF tone stimuli. The tone intensities and the BF are shown. The red traces are 10× averaged EPSCs, and the blue traces were 10× averaged IPSCs. The evoked current responses were converted into the conductance and presented to accelerate the comparison between EPSC and IPSC. B, C, In most neurons, the contralateral EPSCs (B) and IPSCs (C) were larger than the ipsilateral EPSCs (B) and IPSCs (C). The ratios of the peak and charge of the ipsilateral responses to those of contralateral responses were plotted against the sound level. Dotted lines indicate that the ratio was equal to 1. The ratio <1 indicates that the contralateral response is larger than the ipsilateral response. D, The number of the cells with three types of evoked charge sound-level functions. M, Monotonic; S, saturated; N, nonmonotonic. E, The comparison of the thresholds of contralateral and ipsilateral responses. The different dot sizes indicate the different number of cells. Dashed lines are unity lines. F, The comparison of the thresholds of EPSCs and IPSCs. contra-EPSCs, 44.0 ± 4.0 dB, n = 24; ipsi-EPSCs, 54.0 ± 3.3 dB, n = 24; contra-IPSCs, 51.6 ± 4.9 dB, n = 19; ipsi-IPSCs, 52.6 ± 4.8 dB, n = 19.
