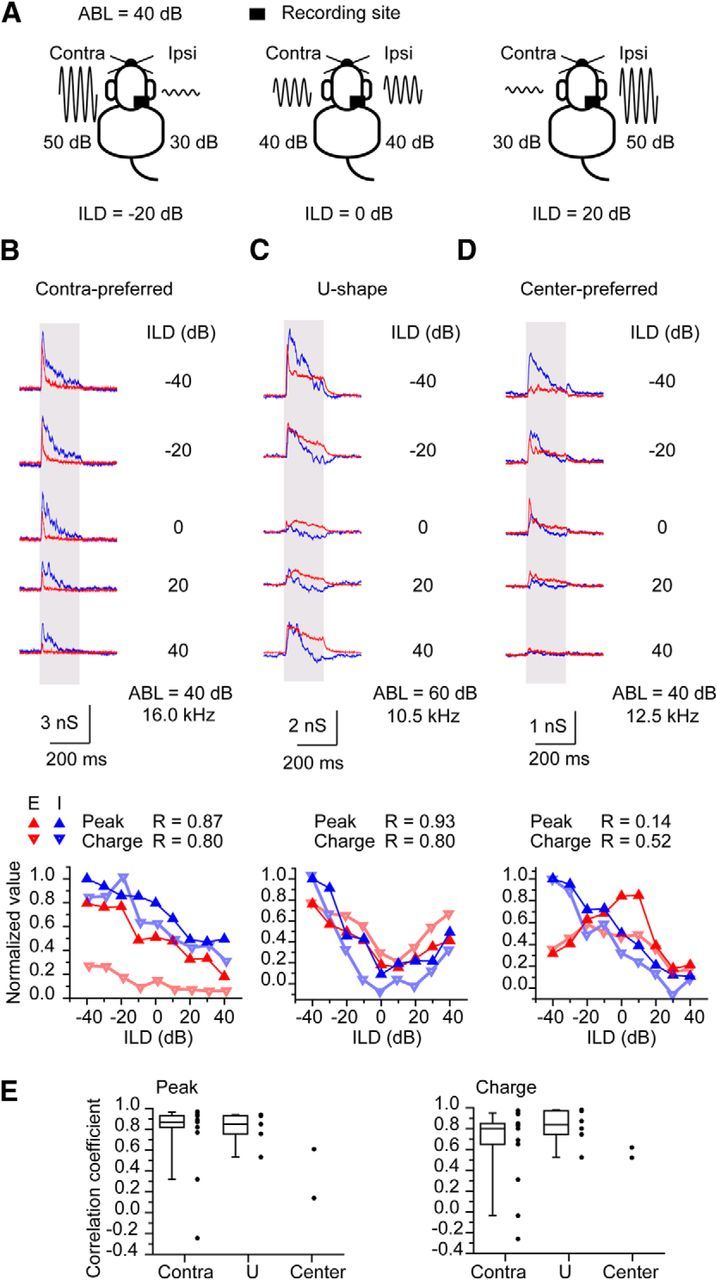
Figure 4.

Synaptic responses of IC neurons to ABL stimuli. A, Schematic drawings of ABL stimuli. ABL was made 40 dB SPL, and the ILD was changed. B, Contra-preferred neuron. C, U-shaped neuron. D, Center-preferred neuron. BF of each neuron was shown. Top, The traces of the synaptic responses. Bottom, The normalized plots of the peak amplitude and the charge of the responses against ILD. The correlation of coefficients between the binaural responses of EPSC and IPSC are shown. E, Population data of correlation coefficients between the binaural responses of EPSCs and IPSCs. For the contra-preferred neuron (n = 13) and the U-shaped neuron (n = 6), box plots are presented with raw data points. For center-preferred neurons (n = 2), only raw data points were presented. The whiskers represent 10 and 90 percentiles.
