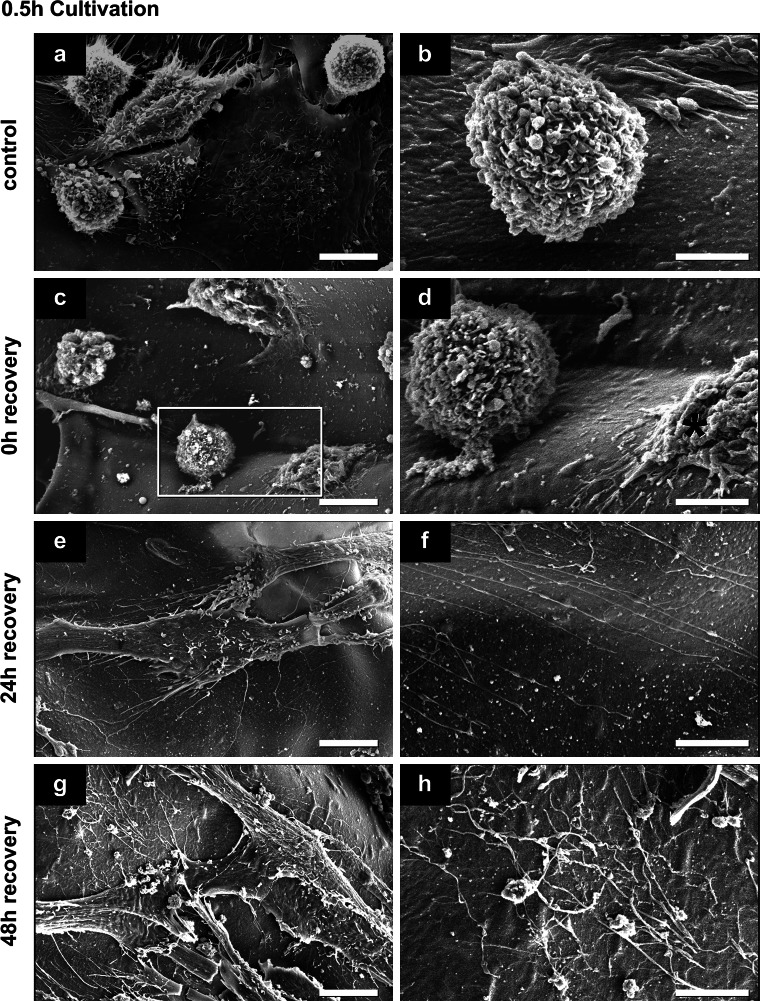
Fig. 4.
Representative secondary electron SEM-images of hMSCs surface features and behavior before and after cryopreservation after a 0.5 h cultivation (n = 3). d Rectangle marked part of image shown in c. Damaged cell in d is marked with red asterisk. Scale bars in a, c, e and g indicate 10 μm; in b, d, f and h 5 μm (Color figure online)

