Fig. 1.

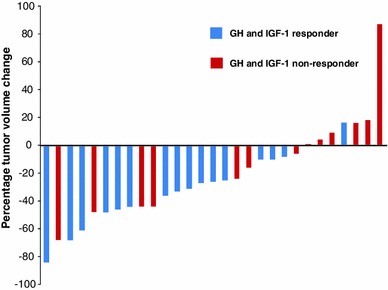
Percentage change in pituitary tumor volume from core study baseline to the last extension study visit (n = 29). The GH and IGF-1 responders shown here are those who were responders at any time point

Percentage change in pituitary tumor volume from core study baseline to the last extension study visit (n = 29). The GH and IGF-1 responders shown here are those who were responders at any time point