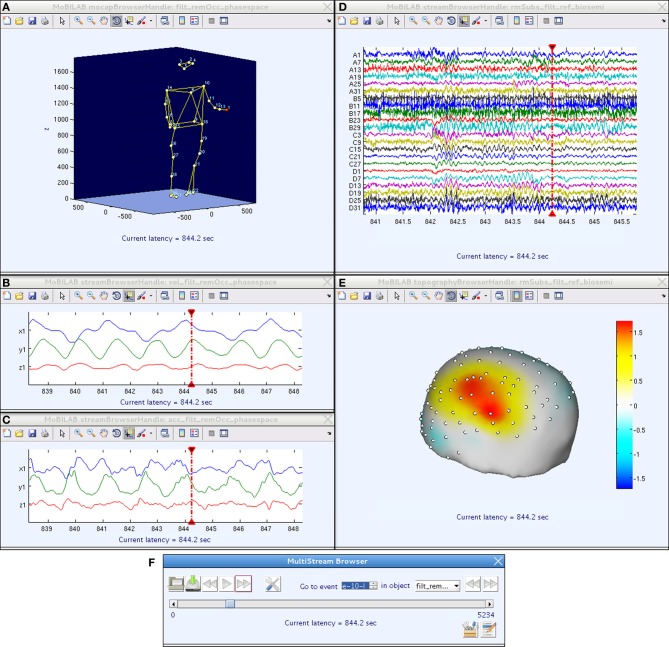
Figure 3.
A MoBILAB Multi-Stream Browser session comprising five (top) MATLAB figure windows that give user-selected, temporally coordinated views of raw and/or derived data streams within a multi-stream MoBI dataset, plus (bottom) a browser control window. (A) Full body motion capture of participant's rhythmic hand and arm movements, animated on a 3-D human stick figure whose body position depicts subject position at the current moment (CM) in the data, marked in the scrolling time series data windows by CM indicators (vertical red lines). (B,C) Derived (x, y, z) velocity and acceleration time series for the (red) left hand marker in (A), shown in a 10-s window containing the CM. (D) EEG time series for a 32-channel EEG channel subset, shown in a 5-s window containing the CM. (E) The EEG scalp topography at the CM, visualized by interpolating the channel EEG data on a template head model. (F) The Multi-Stream Browser control window. Movement of the CM in all browser windows at once can be controlled either by manipulating the play buttons or scroll bar in this window or by moving the red vertical CM indicator in any scrolling data window. Pressing play will animate the stick figure and scalp map displays to match the advancing CM. Data from (Leslie et al., in press).

