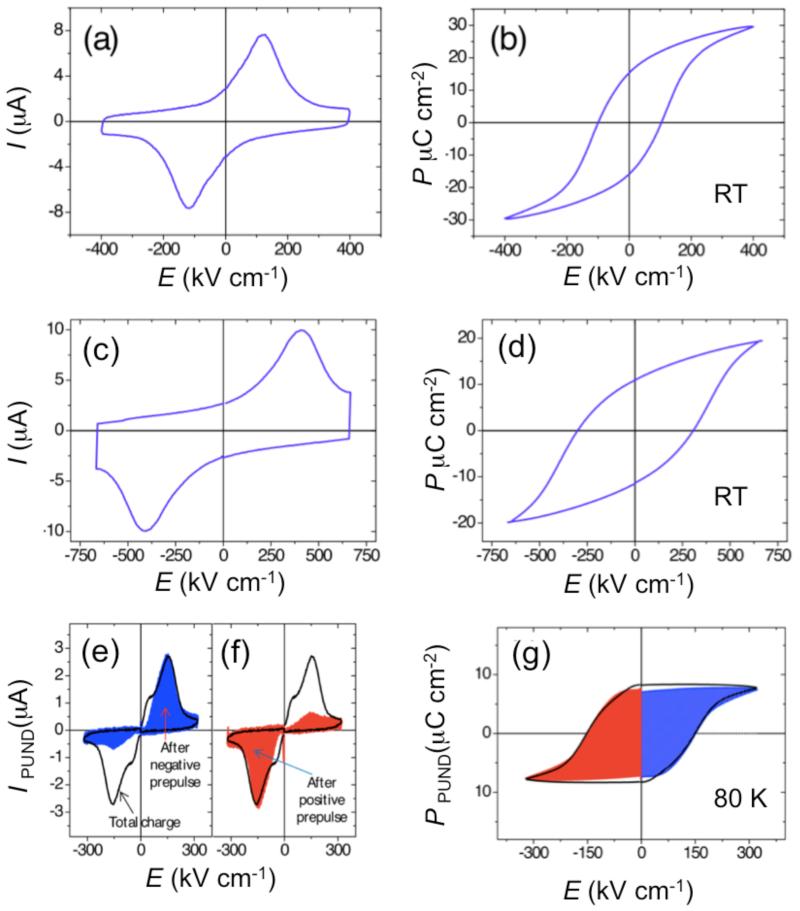
Figure 3. Ferroelectric characterization.
(a) I-E characteristics recorded at room temperature and 100 Hz. (b) P-E dynamic loop obtained by integration through time of data of (a). (c) I-E characteristics and (d) P-E dynamic loop measured at 5 Hz and at 80 K. (e) The black line corresponds to a “standard” PUND measurement. The blue line corresponds to PU and ND measurements after pre-polarizing the sample with −5 V pulse of 1 s and waiting 100 s. The blue dashed area for positive E is proportional to the remanent charge 100 s after negative poling. (f) Black line idem to (e) while the red line corresponds to PU and ND measurements after pre-polarizing the sample with +5 V pulse of 1 s and waiting 100 s. (g) Black line: polarization versus voltage loop obtained from the integration through time of the current measured in a complete PUND measurement. The blue (red) line and area correspond to the portion of the polarization loop obtained by integration of the PU (ND) measurement performed 100 s after pre-polarizing the sample with −5 V (+5 V). The strong similarity between the black loop and the blue-red one, indicates good polarization retention after 100 s.

