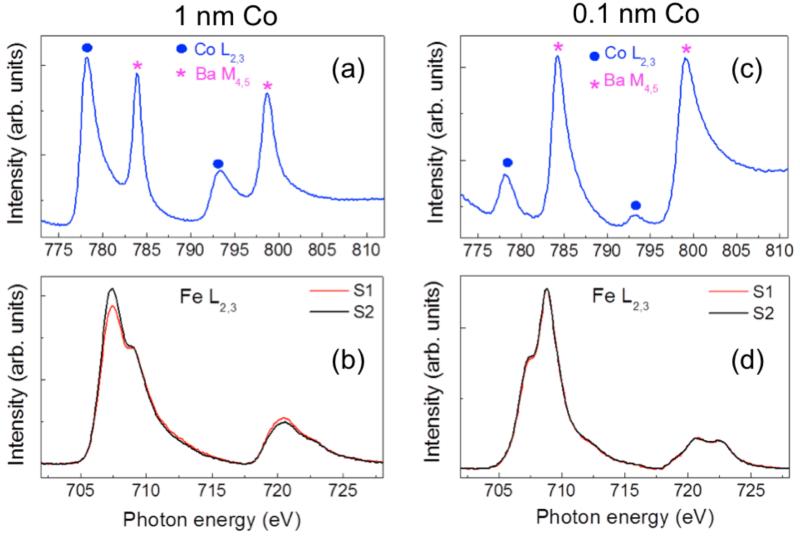
Figure 4. XMCD after ferroelectric depolarization.
Panel a (b): S1+S2 signal at Co-L2,3 edge (S1 and S2 spectra collected at Fe-L2,3 edge) taken at room temperature on Au/Co/Fe/BTO/LSMO//STO capacitors in case of 1 nm thick Co layer. Panel c (d): As in panels a (b) but in case of a sample with negligible quantity of Co. In this case no evidence for ferromagnetism is found, thus indicating that a thick enough Co overlayer (1 nm) is needed to stabilize ferromagnetism within the 2 nominal MLs of Fe on BTO. Energy peaks indicated with stars in the top panels correspond to Ba M4,5.

