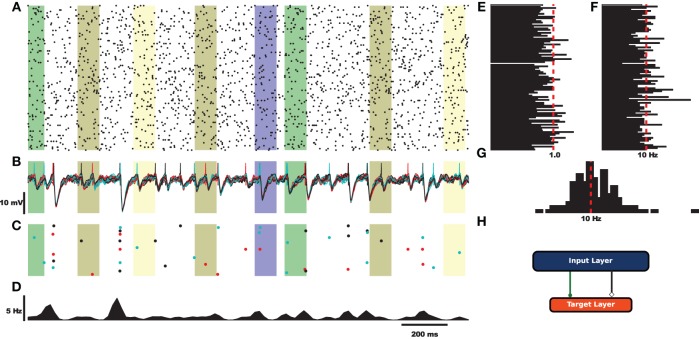
Figure 1.
Example analysis of simulated data using a derived voltage input class. For this example the rectangular bars highlight regions where different signals are injected into the network. (A) Raster plot of 100 cells selected from the input layer. (B) Voltage traces of the target layer neurons. (C) Raster plot of the target layer. (D) Fire rate of the target output neurons calculated using a Gaussian window function. (E) Coefficient of variation for 100 cells of the input layer. (F) Average rate for the 100 sample cells. (G) Spike count histogram for the input neurons. (H) Fully connected feed-forward network.

