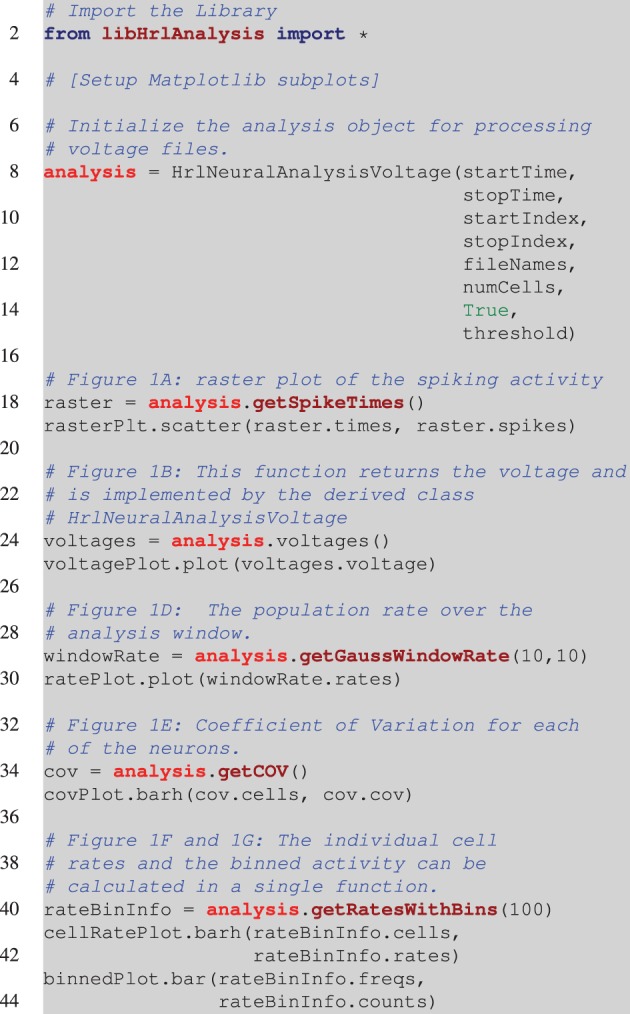
Listing 1.

Pesudocode for creating Figure 1. This is incomplete and assumes that the appropriate Matplotlib axes are setup on Line 4. The analysis object is instantiated on Line 8. This is a voltage object that is specific to processing HRLSim™ voltage files. As arguments the constructor requires, startTime and stopTime, which define the region of interest within the experiment, the range of neurons defined by the startIndex and stopIndex variables, a vector with the file paths containing the raw voltage data as the fileNames variable, the number of cells in this voltage file, numCells (this is because of the data format), a boolean to tell the analysis if the voltages should be converted into spikes, and finally the membrane voltage threshold for extracting spikes, threshold. The remaining lines of code perform the analysis and create the individual plots. Note that Figure 1C is created using a separate analysis object that extracts information about a different cell population but is exactly the same as Line 18.
