Figure 1.
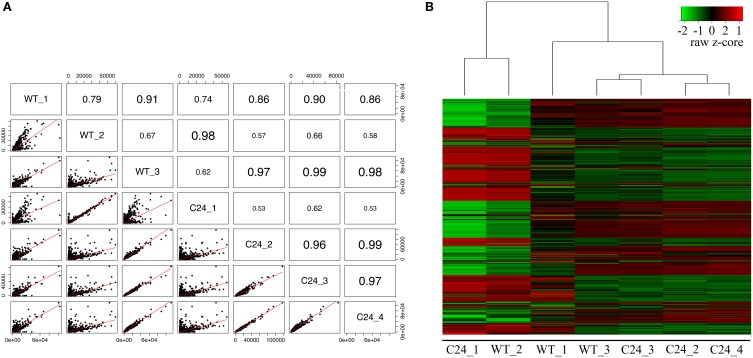
Transcriptome profiling of Smnwt/elavGAL4 (WT) and Smnwt/elavGAL4-C24 (C24) Drosophila strains. (A) Correlation between samples estimated from normalized counts of gene expression of ~12,000 genes in WT (N = 3) and C24 (N = 4) paired-end mRNA-seq libraries. Font size is varying according to the value of correlation. (B) Overview of hierarchical clustering of mRNA-seq datasets. Hierarchically clustered gene expression profiles were performed using the estimation of stabilized variance of normalized counts of gene expression as in (A). Genes are ordered on the vertical axis. Values are displayed as a Z-score (mean = 0 and SD = 1) across samples. The magnitude of deviation from the median is represented by the color saturation. We observed that samples do not cluster according to the known biological origin.

