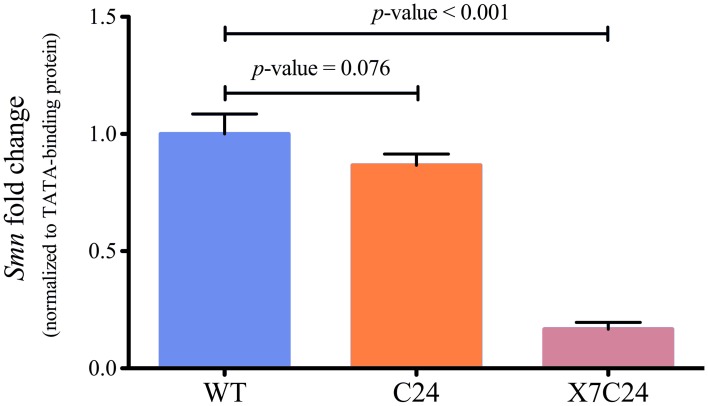
Figure 5.
RT-qPCR quantification of Smn expression levels in CNS samples from WT, C24, and X7/C24 fly strains. Average fold change and standard deviation (N = 3). Relative expression levels determined with the 2∧ddCt method using the TATA-Binding protein as reference gene. Smn is only significantly down regulated in SmnX7/elavGAL4-C24 (X7/C24) flies (t-test p-value < 0.0001).

