Figure 8.
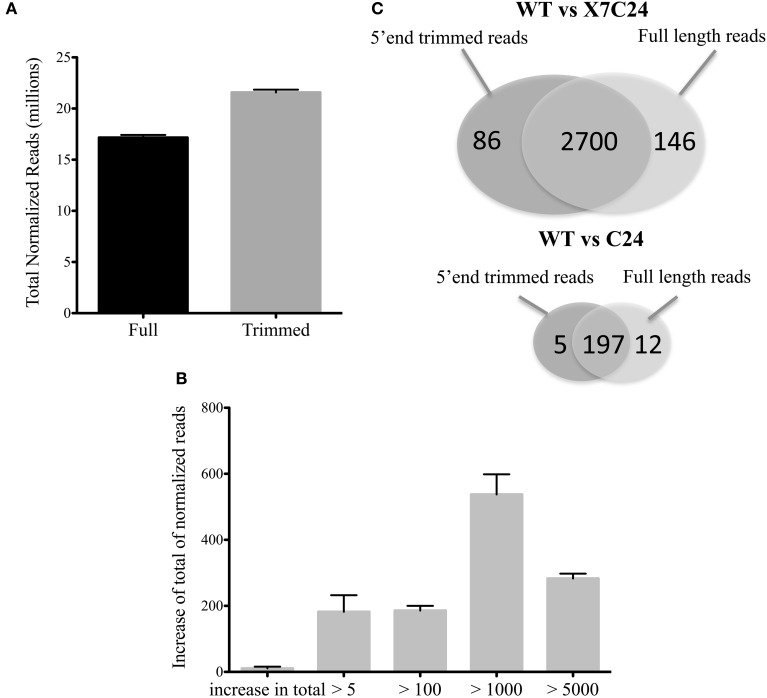
Effect of 5′ end trimming on gene coverage. (A) Total reads mapped to protein coding features after performing trimming of 10 nucleotides from 5′ ends of all raw reads (Trimmed) and without trimming (Full) in all libraries of WT, C24, and X7/C24 that passed QC analysis. (B) Average gain and s.e.m of normalized reads mapped to protein coding genes after trimming, shown according to class of sequencing depth (estimated over normalized reads) per library (WT, C24, X7/C24). Class of sequencing depth as follows: over 5 reads (>5), over 100 reads (>100), over 1000 reads (>1000), or over 5000 reads (>5000). (C) Venn diagram of total number of differentially expressed genes (adj p-value < 0.05) in Trimmed vs. Full datasets for WT vs. C24 and WT vs. X7/C24.

