Figure 6.

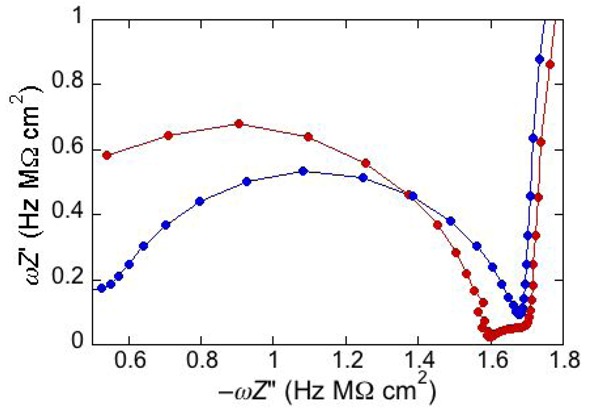
Plot of ωZ′ against −ωZ′′ for a DPTL/(DOPC:PSM:Chol) tBLM at −0.60 V in an aqueous solution of 0.1 M KCl and 1.4 × 10⁻⁷ M melittin (red curve) and for a DPTL/DOPC tBLM in the same solution (blue curve).

Plot of ωZ′ against −ωZ′′ for a DPTL/(DOPC:PSM:Chol) tBLM at −0.60 V in an aqueous solution of 0.1 M KCl and 1.4 × 10⁻⁷ M melittin (red curve) and for a DPTL/DOPC tBLM in the same solution (blue curve).