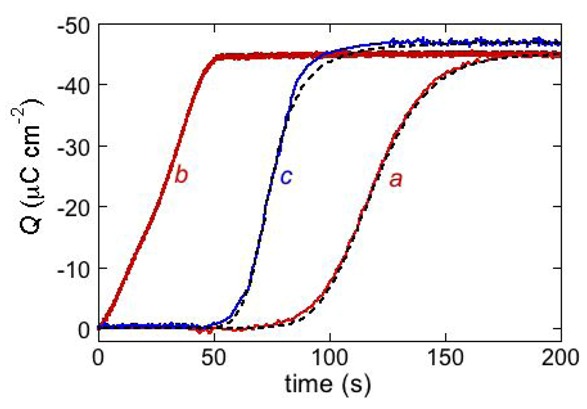
Figure 10.

The red curves a and b are charge transients following potential jumps from −0.30 V to the −1.00 V at a DPTL/DOPC tBLM immersed in aqueous 0.1 M KCl containing 0.4 μM distinctin. Curve a was obtained by the pristine potential jump; curve b was obtained by a second potential jump after a rest time of 30 s at −0.30 V. The dashed curve a was calculated using the parameters θ0 = 0.1, n = 2, kh,N vh,R2 = 1 × 10⁻⁴ s−3, kN kR2 = 4 × 10³ s−3, kd,R = 7 × 10⁻³ cm2 s−1 and p = 0.1. The parameter θ0 denotes the fraction of the whole surface of the tBLM initially covered by flat clusters. The blue curve c is a charge transient following a potential jump from −0.30 V to −0.65 V at a DPTL/DOPC tBLM immersed in aqueous 0.1 M KCl containing 0.4 μM alamethicin. The corresponding dashed curve was calculated using the parameters θ0 = 0.4, n = 2, kh,N vh,R2 = 1 × 10⁻⁶ s−3, kN kR2 = 4 × 10⁴ s−3, kd,R = 7 ×10⁻³ cm2s−1 and p = 1.
