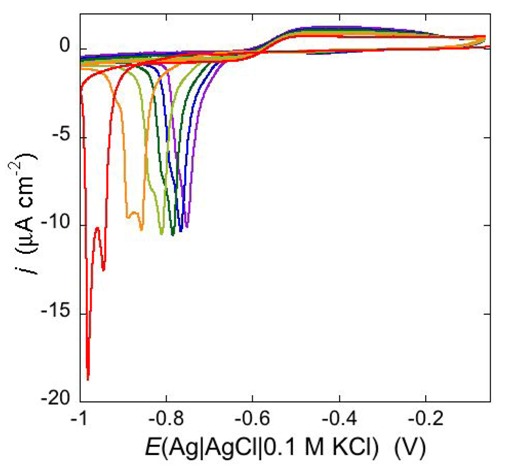
Figure 12.

Cyclic voltammograms of a freshly prepared DPTL/DOPC tBLM immersed in aqueous 0.1 M KCl containing 1 μM TCG. Proceeding from left to right, the cyclic voltammograms were obtained at a scan rate of 10 mV s−1 after 1, 3, 6, 9, 12 and 15 cycles from the instant of the addition of the peptide.
