Figure 14.

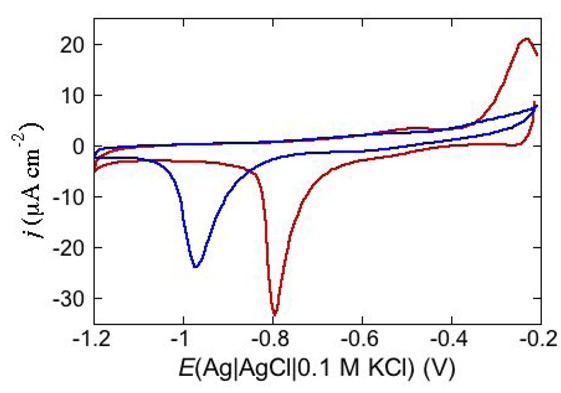
Cycle voltammogram of a DPTL/DOPS tBLM in a pH 7 buffer solution of 0.1 M KCl and 4 μg mL−1 DCD at a scan rate of 50 mV/s before (blue curve) and after addition of 4 × 10⁻⁵ M ZnSO4 (red curve).

Cycle voltammogram of a DPTL/DOPS tBLM in a pH 7 buffer solution of 0.1 M KCl and 4 μg mL−1 DCD at a scan rate of 50 mV/s before (blue curve) and after addition of 4 × 10⁻⁵ M ZnSO4 (red curve).