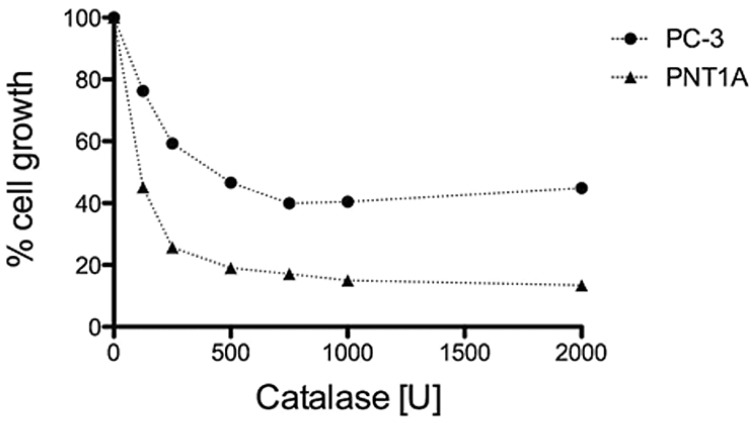
Figure 4.
Growth effects of H2O2 elimination on PC-3 and PNT1A cells. Cell numbers were measured using crystal violet following a 72 h continuous exposure, and are displayed as % cell growth compared to untreated cells. The displayed data represent the average ±SEM of three independent experiments. Dose-dependent growth inhibition by catalase was observed in both cell lines, with PC-3 cells requiring higher concentration of catalase (IC50 = 580 ± 160 U/mL) to block cell proliferation, and PNT1A cells requiring lower concentration of catalase (IC50 = 75 ± 40 U/mL). The IC50 values were calculated using curve fit (GraphPad Prism) and applying a non-linear fit log (Cinhibitor) versus normalized response.

