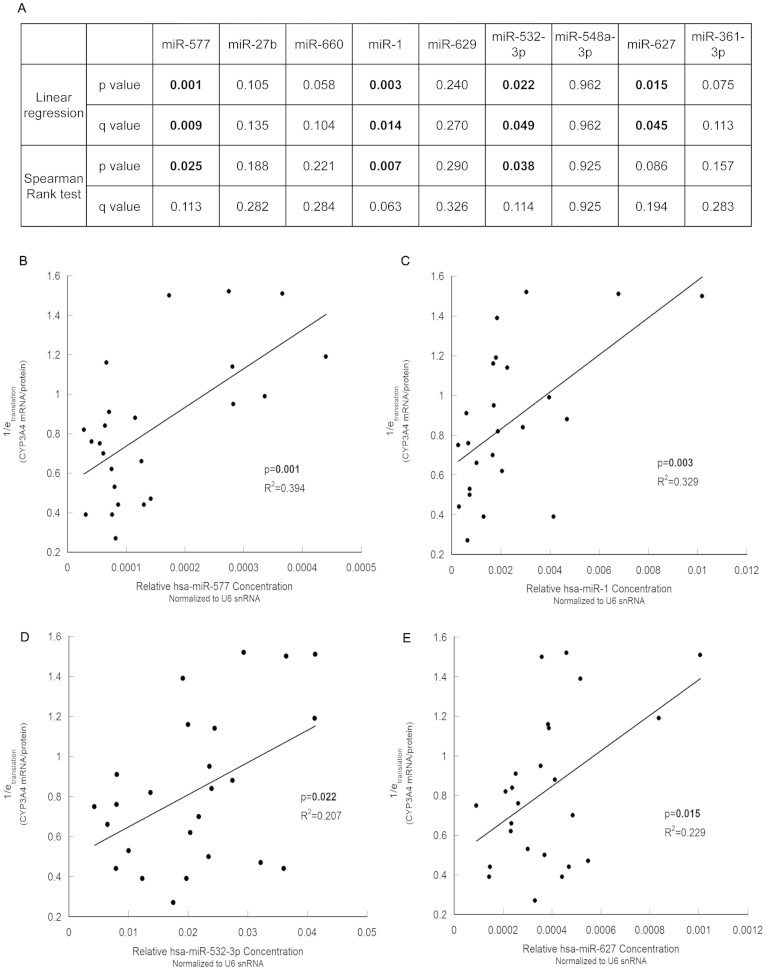
Figure 3. The correlation between each miRNA and 1/etranslation (mRNA/protein) of CYP3A4 in human liver samples.
(A), The significance of linear regression and Spearman's rank test between candidate miRNAs and 1/etranslation. Significant p values or q values are in boldface. (B), (C), (D) and (E), the 1/etranslation of CYP3A4 was significantly correlated with the relative concentration of hsa-miR-577 (B), hsa-miR-1 (C), hsa-miR-532-3p (D) and hsa-miR-627 (E). N = 27.

