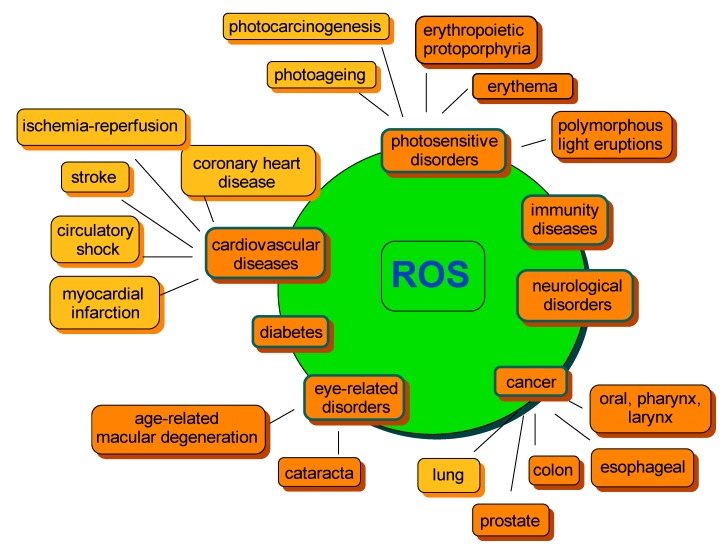
Figure 3.
Examples of ROS-mediated disorders. The orange color indicates the beneficial effect of carotenoids on disease risk development. The yellow color indicates that an equivocal effect was reported. The diagram was constructed on the basis of information from several studies cited within the text.

