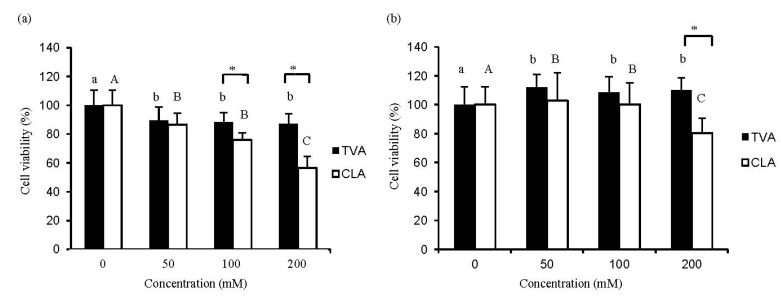
Figure 1.
Changes in the number of MCF-7 (a) or MCF-10A (b) cells after exposure to trans vaccenic acid (TVA) or c9, conjugated linoleic acid (t11-CLA) at the concentration of 0, 50, 100 and 200 mM for 72 h. Cell growth was measured by the uptake of MTT dye and absorbance at 550 nm. Results of the MTT data were analyzed using a one-way ANOVA. SD values are shown as error bars (n = 8). Lower cases indicate significantly different (p < 0.05) in TVA group; while the upper cases indicate significantly different (p < 0.05) in CLA group. The asterisk indicates significantly different (p < 0.05) between TVA group and CLA group.

