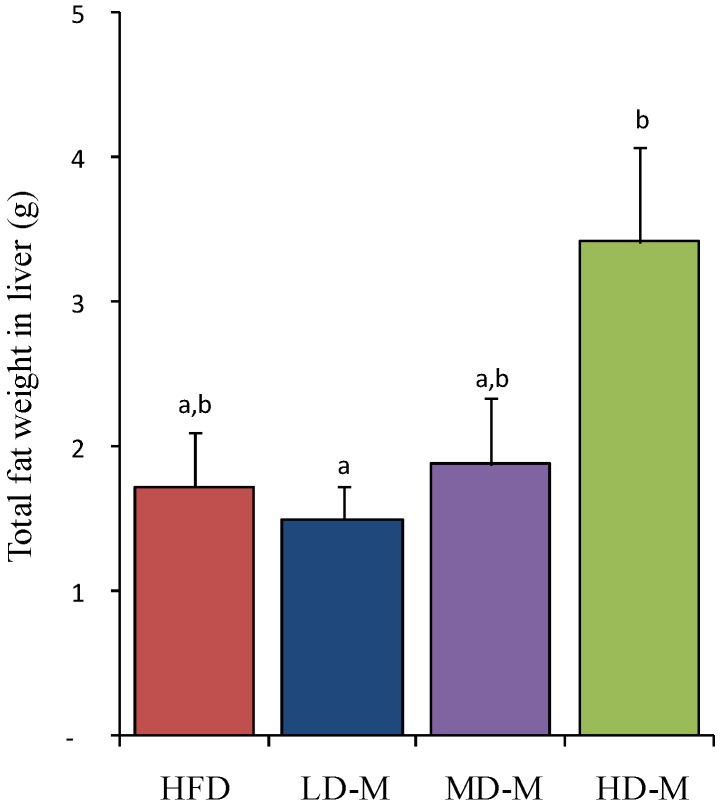
Figure 1.
The total fat in the liver was measured after 6 weeks dietary treatments in rats. Bars represent mean ± SEM. a,b Means not sharing a common letter are significantly different among groups at p = 0.024. HFD, high fat diet; LD-M, low dose mushroom in HFD; MD-M, medium dose mushroom in HFD; HD-M, high dose mushroom in HFD.

