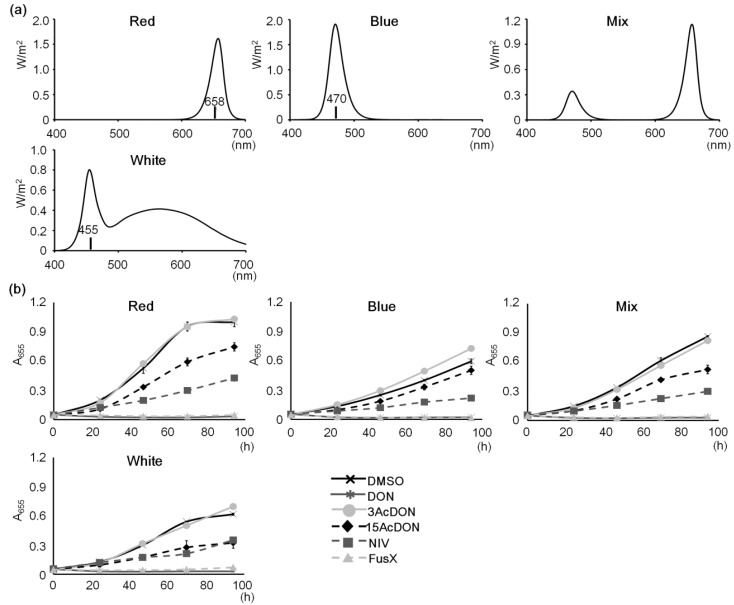
Figure 2.
Spectral differences and sensitivities to mycotoxins. (a) LED spectral characters. Each graph is represented by the integration of irradiance. They only indicate spectral characters, not photosynthetic photon flux density (PPFD). Mix LED consists of the same components of red and blue LEDs. The maximal wavelength of each LED is indicated in the graph; (b) Growth test for comparing spectral characters. Lighting condition was 240 μmol m−2 s−1 of each LED. DMSO was the control. A655 = absorbance 655 nm, Bars represent S.E. (n = 3).

