Fig. 5.
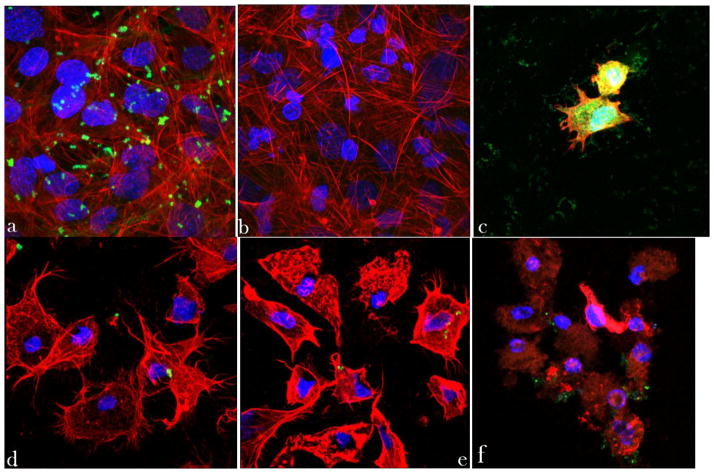
Z-stacked confocal optical images of fluorescently stained osteoblastic cell nuclei (blue) and cytoskeletal f-actin (red), invaded with S aureus (green) previously made potentially resistant to CL therapy: (a) positive control stained immediately following the infection, showing intracellular presence of the bacterium; (b) negative control at 48 h of incubation time; (c) positive control at 48 h of incubation time; co-cultured samples incubated with 2 mg/cm2 of HAP/CL (d), ACP/CL (e), and DCPA/CL (f). The size of each image is 450 × 450 μm.

