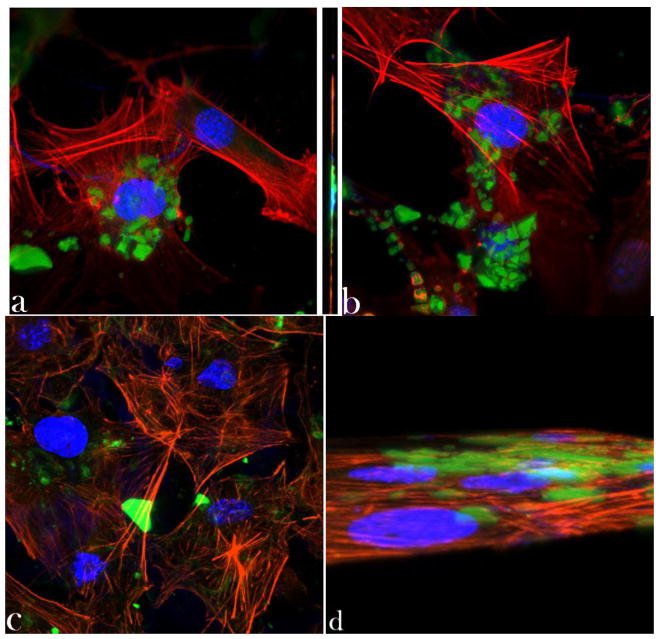
Fig. 7.
Single plane confocal optical images of fluorescently stained osteoblastic cell nucleus (blue) and cytoskeletal f-actin (red), and CL-containing CAP particles (green) of different monophasic compositions – HAP (a, d), ACP (b), and DCPA (c) – following 48 h (a) and 4 h (d) of incubation. The sizes of images are 270 × 270 μm.

