Figure 2.

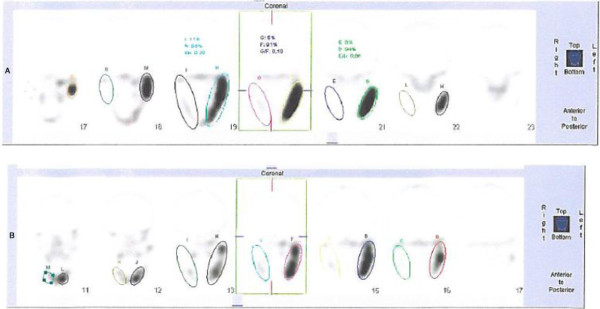
Single photon emission computed tomography of the jaw at month 0 before treatment, panel A (left-right ratio 1:16.4) and after 24 months of zoledronic acid treatment, panel B (left-right ratio 1:4.4).

Single photon emission computed tomography of the jaw at month 0 before treatment, panel A (left-right ratio 1:16.4) and after 24 months of zoledronic acid treatment, panel B (left-right ratio 1:4.4).