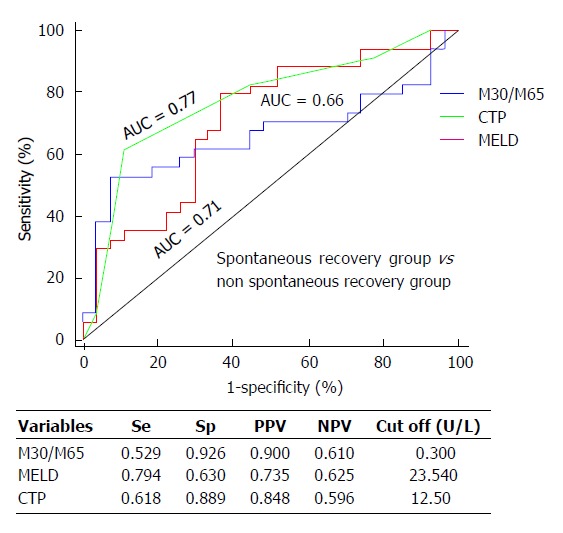
Figure 4.

Comparison of the prognostic values of Model for End-Stage Liver Disease, Child-Pugh score and the ratio of M30/M65 in acute-on-chronic liver failure patients. Se: Sensitivity; Sp: Specificity; PPV: Positive predictive value; NPV: Negative predictive value; MELD: Model for End-Stage Liver Disease; AUC: Area under the curve.
