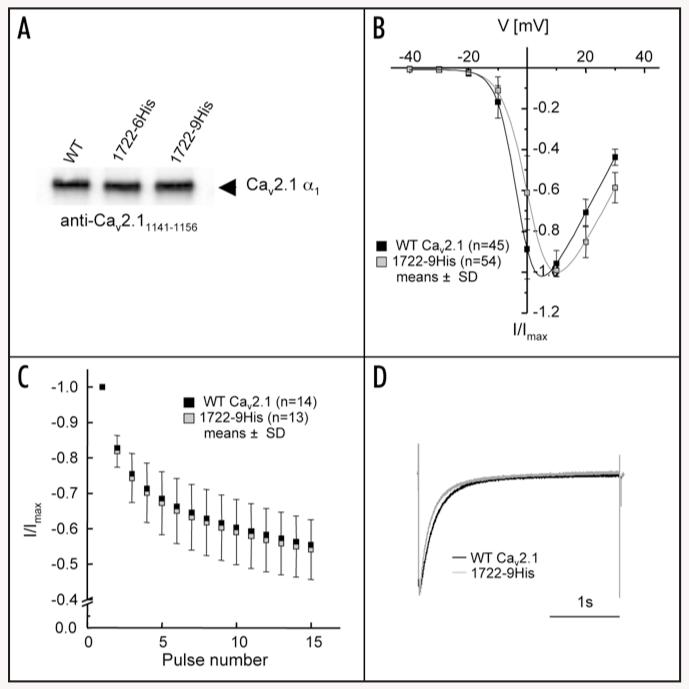
Figure 5. Oligo-histidine-tagged CaV2.1 α1 shows equal protein expression to wild-type but significant differences in functional analyses.
(A) Western blot analysis of 1722-6His and 1722-9His stained with rabbit antibody anti-CaV2.11141-1156.16 All subunits migrated at the expected molecular mass as indicated by an arrow. One representative experiment of four is shown. (B) Wild-type CaV2.1 α1 (black) and 1722-9His (grey) were injected into Xenopus oocytes and after 2-4 days IBa was measured (10 mM Ba2+ as charge carrier) in the indicated number of cells. IV-curves were determined by depolarising pulses to test potentials ranging from −40 to +30 mV from a holding potential of −80 mV and revealed a significant shift to more depolarised voltages (Table 1). (C) No changes could be detected in the use-dependence protocol but significant changes were obtained during a 3-s depolarising pulse to Vmax. (D) Representative traces for wild-type and 1722-9His all normalised to a peak IBa of 1 μA obtained during a 3-s depolarising pulse from holding potential −80 mV to Vmax. Data are presented as means ± SD.

