
Figure 4.
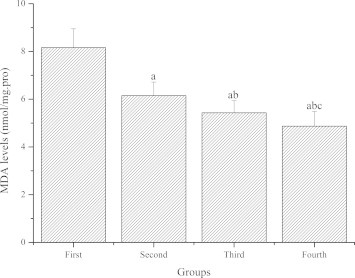
The effect of GL-PS on MDA levels in skeletal muscle. The data were expressed as means ± SD (n = 10 per group). ∗P < 0.05 when compared to the first group. ∗∗P < 0.05 when compared to the second group. ∗∗∗P < 0.05 when compared to the third group.